 |
Weather Eye with John Maunder |
The ‘Maunder Minimum' is the name given to the period from 1645 to 1715 when the number of sunspots – ‘storms' on the sun – became almost zero.
The period is named after the solar astronomer Edward Walter Maunder (1851-1928), who was working at The Royal Observatory at Greenwich when he discovered the dearth of sunspots during this period.
During one 30-year period within the Maunder Minimum there were only about 50 sunspots compared with a more typical 40,000. Maunder was a driving force in the foundation of the British Astronomical Association and a Fellow of the Royal Astronomical Society.
The sun was well observed during the period of the Maunder Minimum and this lack of sunspots is well documented. This period of solar inactivity corresponded to a climatic period called the ‘Little Ice Age' when in Europe rivers that were normally ice-free, froze and snow fields remained at low altitudes throughout the year.
There is evidence the sun had similar periods of inactivity during the years 1100-1250 and 1460-1550. Sunspots generally follow a cycle of about 11 years, but cycles have varied from eight-15 years. The connection between solar activity and the earth's climate is an area of ongoing and sometimes controversial research.
An approaching Grand Solar Minimum is gaining 'support” including NASA with their recent SC25 prediction — though they stay clear of the implications. NASA's forecast for the next solar cycle (25) reveals it will be the weakest of the last 200 years.
The maximum of this next cycle — measured in terms of sunspot number, a standard measure of solar activity level — could be 30 to 50% lower than the most recent one. The agency's results show that the next cycle will start in 2020 and reach its maximum in 2025:
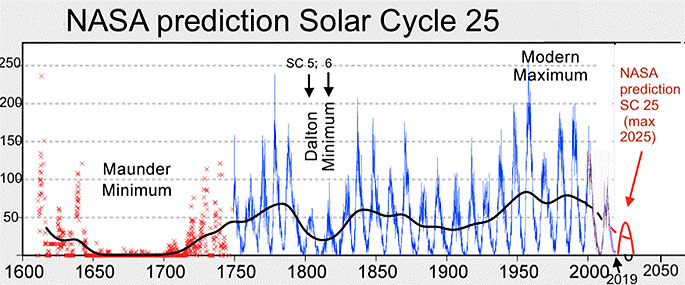
The above chart and the following comment is from NASA's official website (www.nasa.gov):
The new research was led by Irina Kitiashvili, a researcher with the Bay Area Environmental Research Institute at NASA's Ames Research Center, in California's Silicon Valley. It combined observations from two NASA space missions – the Solar and Heliospheric Observatory and the Solar Dynamics Observatory – with data collected since 1976 from the ground-based National Solar Observatory. One challenge for researchers working to predict the Sun's activities is that scientists don't yet completely understand the inner workings of our star. Plus, some factors that play out deep inside the Sun cannot be measured directly. They have to be estimated from measurements of related phenomena on the solar surface, like sunspots.
Time will tell whether the sun will once again go into another ‘Maunder Minimum' within the lifetime of the present generation, but if this happens we're likely to have a much colder climate for a few decades.
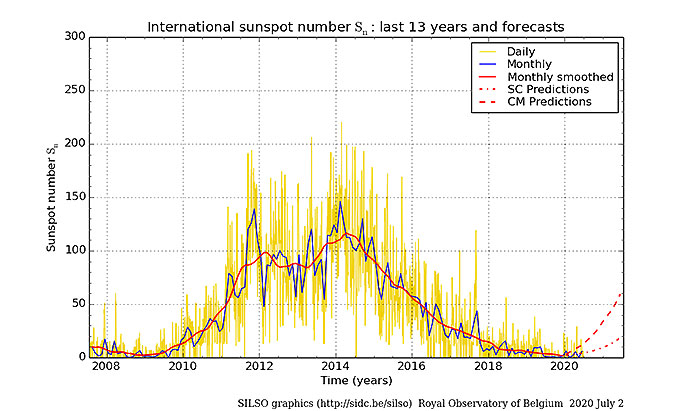
The sunspot number for most days during the last three months is zero.
A sunspot is a relatively dark, sharply defined region on the solar disc – marked by an umbra, dark area, which is 2000 degrees cooler than the effective photospheric temperature. The average diameter of a sunspot is 4000 km, but they can exceed 200,000 km.
Sunspots are temporary phenomena on the Sun's photosphere that appear as spots darker than the surrounding areas. They are regions of reduced surface temperature caused by concentrations of magnetic field flux that inhibit convection. Sunspots usually appear in pairs of opposite magnetic polarity. Individual sunspots or groups of sunspots may last anywhere from a few days to a few months, but eventually decay.
The NASA solar physics website, and other websites such as the Royal Observatory of Belgium, include information on sunspot numbers, the ‘Maunder Minimum' and sunspot cycle predictions.
The sunspot index is updated monthly and available from 1749. The last time the monthly sunspot number was above 100 during the last 14 years was in September 2002, when the value was 110. February 2014 had a sunspot value of 102.
The last time the value was above 200 was in August 1990, when the value was 200.3..
*************************************
For further information on a range of weather.climate matters Google climatediceandthebutterfly

{$commentCount}
Leave a Comment