The market's downswing continues to roll on, albeit unpredictably, as property values across Aotearoa NZ weakened in June with the monthly rate of decline accelerating, down 1.2 per cent compared to the 0.7 per cent fall in May.
CoreLogic's House Price Index shows the monthly decline was led by weaker figures in Auckland, down 3.0 per cent for the month with four out of six of NZ's main centres recording larger falls in June.
The decline takes the national annual rate of change 10.6 per cent below the same time last year, down from -10.2 per cent in May.
CoreLogic NZ Head of Research, Nick Goodall, says the acceleration in falls illustrates the impact of such a long and strong rate hiking cycle as stretched mortgage affordability continues to constrain demand.
Goodall added that the latest data may be a speed bump for expectations the housing downturn may have already ended, though the variable results evident across the country are likely supportive of the argument that a housing market trough is not far away.
The nationwide average house value remains $183,000 higher than the pre-Covid level in March 2020 but the fall from peak now exceeds $130,000, illustrating just how strong the pandemic-induced growth upswing was.
'Rather than focus too much on the exact timing of the bottom of the market, we believe it's more about assessing the key market drivers and recent changes in those drivers, when setting expectations of where the market is headed.
'The flow of properties being listed for sale has been weak all year – tracking below each of the past three years.
'This, alongside property sales ticking higher, has meant the overall volume of properties on the market is reducing.
'Reduced supply, paired with high net migration, increased confidence, looser credit requirements (CCCFA and LVR) and near-peak mortgage interest rates, have supported demand and provided the setting for upcoming market change.
'Of course, in the same sense, we're not expecting a flood of demand to lead to a strong bounce back in prices by any means.
' Stretched affordability, due largely to still-high property values and high interest rates compared to recent history is likely to keep a lid on demand, which should lead to a much more stable and balanced market once the bottom is reached.”
CoreLogic House Price Index - National and Main Centres
According to the latest CoreLogic Housing Affordability report, more than 50 per cent of the average household income is required to service an 80 pe cent LVR mortgage in NZ compared to 43 per cent in Australia.
Nick says the only consistent trend for house prices in 2023 was the inconsistency, with the monthly rate of change regularly dipping and recovering in back-to-back months.
In June, property values in Auckland fell 3 per cent, while none of the other five main centres saw values shift by more than 0.6 per cent either way. Christchurch had the largest increase over the month (0.3 per cent), while Tauranga also saw values increase 0.1 per cent in June, though values remain 3.4 per cent down over the past three months.
Property values in Dunedin look to have effectively flattened out – three consecutive months of very little movement leaving the quarterly change at -0.4 per cent. Similarly, Christchurch values have generally held relatively firm over the past three months (-0.5 per cent), and are down ‘only' 6.5 per cent annually, making it the best performing main centre over the year.
Values continue to record modest falls in both Wellington (-0.6 per cent) and Hamilton (-0.2 per cent), but the rate of change appears to be moderating with Wellington in particular experiencing a significantly improved rate of change over the three-month measure.
From June to September last year, property values in Wellington fell significantly, down 8.5 per cent. In the latest three months (April to June) values have fallen only 1.4 per cent.
CoreLogic House Price Index – Main Centre Average Value
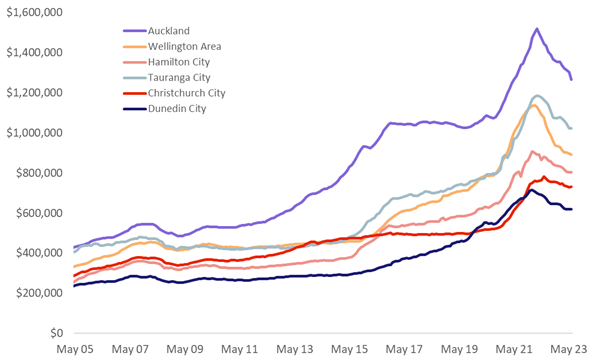
Property values in Wellington have seen the greatest correction, when compared to the recent peak of the market, down 21.8 per cent since the peak – a correction of almost $250,000 on average.
The Hutt region has experienced the greatest falls from peak, with Upper Hutt having almost a quarter of its average value wiped out since values peaked in January 2022 at $959,000.
Despite such a significant drop, Upper Hutt values remain almost $100,000 above pre-Covid (March 2020) levels.
The Upper Hutt market is experiencing some volatility month-to-month, with the monthly measure alternating between negative and positive for each of the past six months.
Nick says for this reason, the latest monthly reading of a 0.7 per cent increase should be treated with caution – the quarterly change of -1.7 per cent provides a much better read of what has happened in that market recently.
'The annual change in Wellington City still paints a grim picture for capital city homeowners, however there has been a moderation in the rate of fall for the quarterly measure.
'The fall of -1.0 per cent is the smallest quarterly decline since April 2022, when the market fell -0.8 per cent over the previous three months. The average value remains above the magic million-dollar mark, but only just at $1.01m.”
Regional House Price Index results
The 5.1 per cent fall in Auckland City (and 6.1 per cent fall in Franklin) looks alarming, however, Nick stresses caution over judging a short-term measure in a volatile market.
'Auckland City had experienced a much more balanced market in the prior three months, tracking sideways (-0.1 per cent) in what looked to be a consolidation period, which is also reflected in the annual rate of decline being the smallest of the Auckland areas (-10.8 per cent).
'While caution should be taken with reading too much into a single month measure, it also shouldn't be ignored. This may be a sign of an increasing number of sellers being encouraged to accept a lower price after having their property on the market for a while, or could reflect a change in circumstance. Either way, we'll be watching future sales performance closely for any increased signs of vendor struggles”.
There is weakness across the rest of Auckland with each area recording a fall in values of more than 3 per cent over the past three months, with the Rodney District the only area to see minimal change over the month (-0.1 per cent).
The average value of property in Waitakere ($994,000) has fallen below $1 million for the first time since March 2021, to now sit 19.0 per cent below its peak – only slightly better than Papakura values, which have fallen 19.2 per cent from peak.
Property market outlook
According to Nick, the ever-changing market dynamics have resulted in inconsistent sales performance, as the demand for property varies across different price ranges, property types, and cities.
'It's just as easy to find pockets of high demand and strong sales as it is to find a property which has been languishing on the market before being discounted. What the data is telling us is that housing market conditions remain diverse. While some markets may be moving through a trough in the cycle, others may have further to decline.
'Nonetheless, we still believe it appears the worst of the downturn is generally over for most areas.”
Nick adds October's general election provides yet another unknown for the property market, especially with the political polls indicating the vote could be a close-run contest between the two major parties.
The Reserve Bank of NZ's decision-making process for the OCR at its July meeting will be another major factor to consider.
'Recent data, including improved confidence, a buoyant labour market and reducing inflation expectations all points to the Bank holding true to their intention of leaving the OCR at 5.5 per cent.
'That will be welcome news for mortgage holders continuing to roll off lower mortgage interest rates over the coming months.”

0 comments
Leave a Comment
You must be logged in to make a comment.