
The seasonally adjusted unemployment rate was 3.9 per cent in the September 2023 quarter, compared with 3.6 percent last quarter, according to figures released by Stats NZ.
“The unemployment rate increased over the past year, up from 3.2 per cent in the September 2022 quarter,” says work and wellbeing senior manager Victoria Treliving.
The underutilisation rate was 10.4 per cent in the September 2023 quarter. This compared with 9.9 per cent from the previous quarter, and 8.9 per cent from the previous year. Underutilisation is a broader measure of spare labour market capacity than unemployment alone.
“Increases in unemployment and underutilisation over the year indicate increasing spare capacity in the labour market following competitive labour market conditions in 2021 and 2022.”
Higher unemployment and underemployment behind rise in underutilisation
In the September 2023 quarter, the number of people who were underutilised increased by 13,000.
Growth in the number of unemployed and underemployed people contributed roughly equal amounts to the increase, up 8000 and 7000 respectively.
The potential labour force fell slightly by 2000.
People who are underemployed are those employed part-time who want, and are available for, more work.
The potential labour force includes people who want jobs but are either unavailable to start work or are not actively seeking work.
Underutilisation grew the most among young adults.
Youth aged 15–24 years accounted for half the total rise in underutilisation over the year – 26,500 out of a total increase of 53,100 (based on non-seasonally adjusted figures).
Compared with the rest of the population, 15–24-year-olds tend to have higher rates of underutilisation. In the September 2023 quarter, the underutilisation rate was 27.0 per cent for those aged 15–24, compared with 7.1 per cent for the rest of the population.
Employment rate falls
The employment rate fell to 69.1 per cent from a series high of 69.8 per cent last quarter. However, the rate remains historically high – the fifth highest rate since the Household Labour Force Survey began in 1986.
“The fall in the employment rate over the quarter reflects two factors – growth in the working-age population and a decrease in the number of employed people,” says Victoria.
The employment rate is the number of employed people as a proportion of the working-age population. The working-age population grew by 31,000 over the quarter, while the number of employed people fell by 6,000.
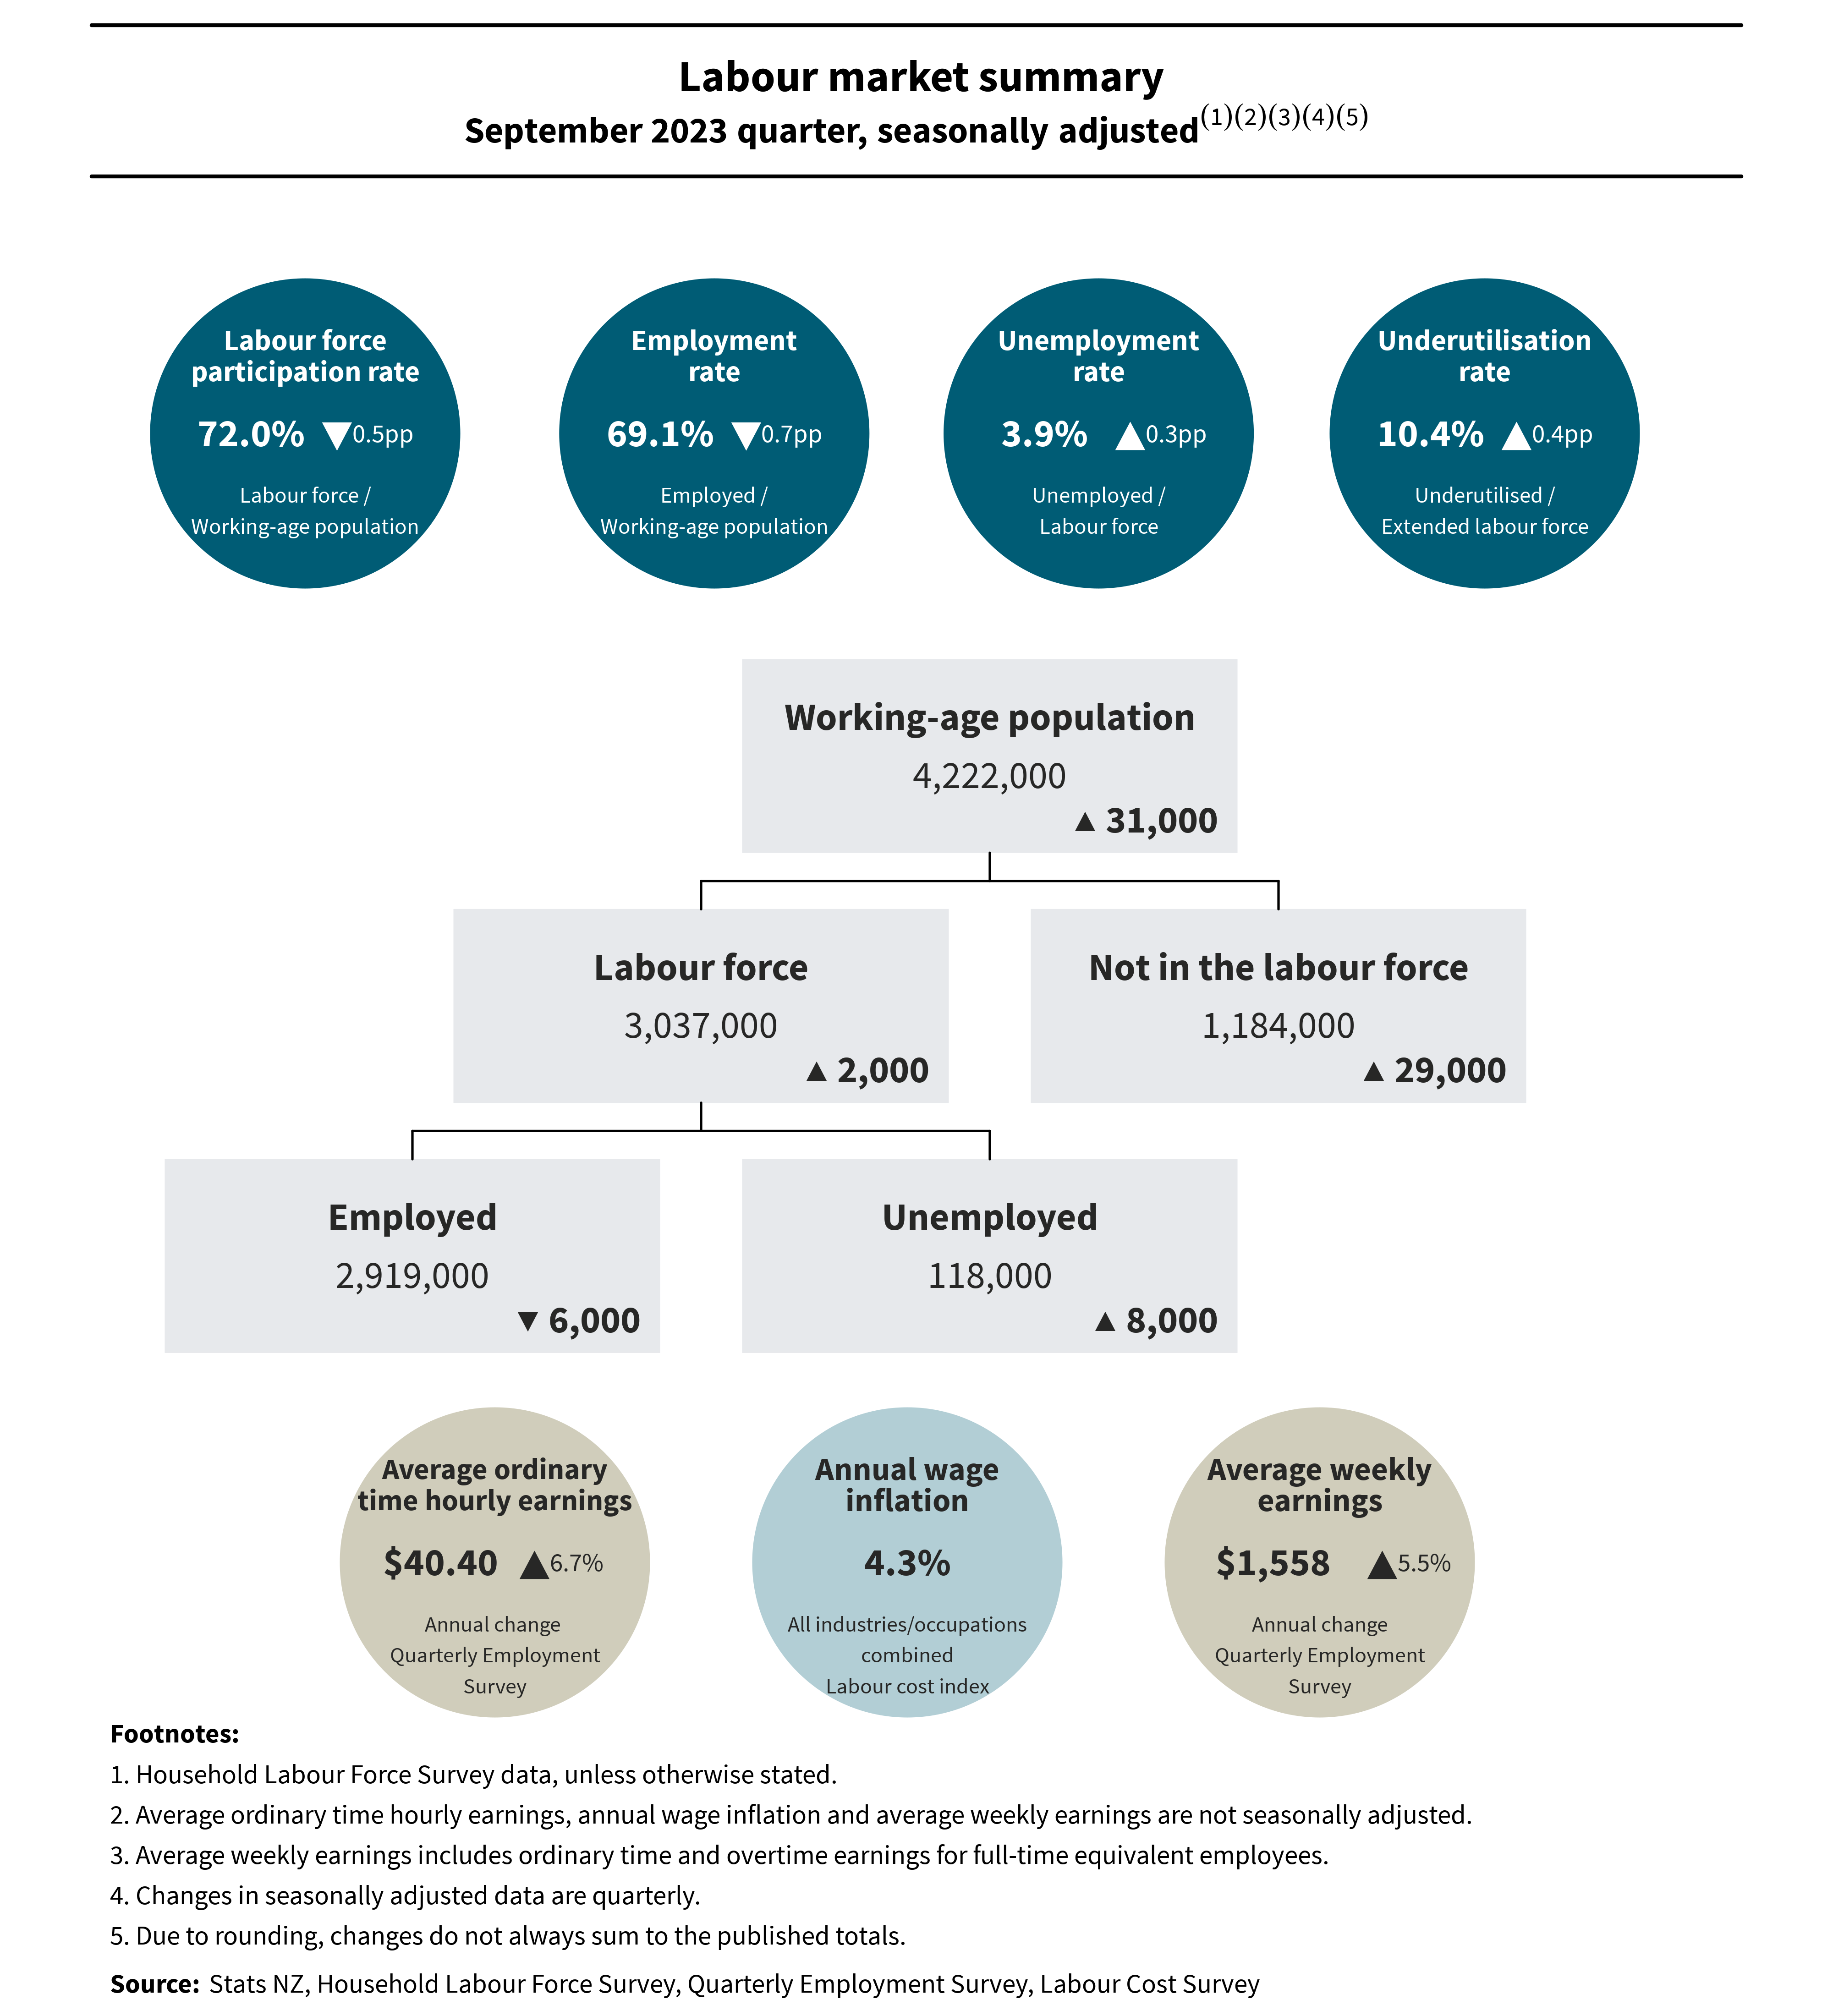
Text alternative for diagram of labour market summary, September 2023 quarter, seasonally adjusted
Diagram shows data from September 2023 quarter’s Household Labour Force Survey (HLFS), Quarterly Employment Survey (QES), and labour cost index (LCI).
HLFS results for the September 2023 quarter showed the labour force participation rate was down 0.5pp (percentage points) to 72.0 percent. This rate is derived from labour force divided by working-age population. The employment rate was down 0.7pp to 69.1 percent. This is derived from employed divided by working-age population. The unemployment rate was up 0.3pp to 3.9 percent. This is derived from unemployed divided by labour force. The underutilisation rate was up 0.4pp to 10.4 percent. This is derived from total underutilised divided by extended labour force.
The working-age population was up 31,000 to 4,222,000. This is made up of the labour force, up 2,000 to 3,037,000, and people not in the labour force, up 29,000 to 1,184,000. The labour force is made up of employed people, down 6,000 to 2,919,000, and those unemployed, up 8,000 to 118,000.
Average ordinary time hourly earnings from the QES were up 6.7 percent annually, to $40.40.
Annual wage inflation from the LCI was 4.3 percent, for all industries and occupations combined.
Average weekly earnings from the QES were up 5.5 percent annually, to $1,558.
Notes:
- Household Labour Force Survey data, unless otherwise stated.
- Average ordinary time hourly earnings, annual wage inflation, and average weekly earnings are not seasonally adjusted.
- Average weekly earnings includes ordinary time and overtime earnings for full-time equivalent employees.
- Changes in seasonally adjusted data are quarterly.
- Due to rounding, changes do not always sum to the published totals.
Source: Stats NZ, Household Labour Force Survey, Quarterly Employment Survey, and Labour Cost Survey.

0 comments
Leave a Comment
You must be logged in to make a comment.